Historian & trends
The historian records tag values to disk so operators can look back, not just at now. Pick the variables worth keeping, set how often each is sampled and how long it is kept, then put a Trend Chart on a page to plot them.
What it records, and where
Every enabled variable is sampled as a number and appended to a local SQLite database at <project>/historian/history.db, with the picking rules in <project>/historian/config.json.
- Only numeric scalars can be logged.
Integer,FloatandBooleanvariables qualify (a Boolean is stored as0/1). Strings, structs and arrays-as-a-whole do not — the variable picker only offers what it can store. One element of an array is fine: pick the index and the row is logged asdatasource:path[0]. - A logged variable is subscribed whether or not it is on screen. Enabling it here puts it on the fast OPC-UA subscription, so a tag that no page binds and no alarm watches is still recorded.
- The database is local to this installation. It is deliberately left out of exports, zips and peer transfers — the configuration travels so the other machine knows what to log, the samples stay behind. See Managing projects.
Choose what to log
- Open the Historian area — Pick Historian in the editor's left rail.
- Add a variable — Click + on Tracked variables and choose the tag from the variable picker. It is added enabled, expanded and ready to configure.
- Set the sampling — Open the row and fill in the two fields that matter:
| Field | Means |
|---|---|
| Logging | On / Off without losing the row's settings. Off also drops it from the fast subscription. |
| Minimum interval | Seconds between samples for this tag. 0 logs every change the PLC reports — right for a step-change flag, wrong for a noisy analogue. |
| Retention | Days of history kept. Older samples are deleted by a cleanup pass that runs hourly. Default 30 days. |
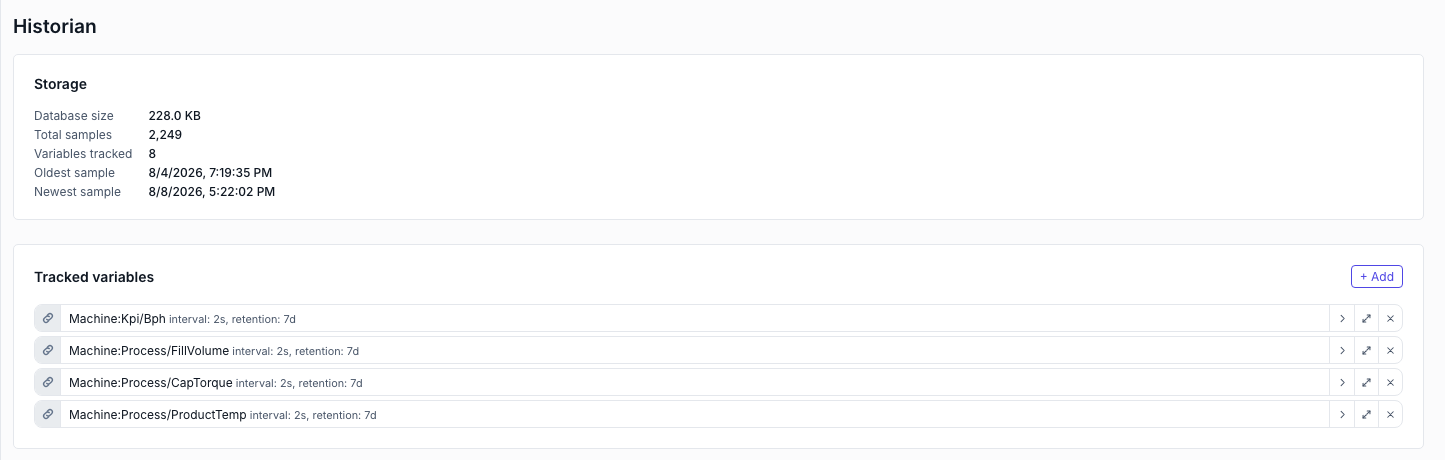
Each collapsed row shows its own summary — interval: 5s, retention: 30d — so the whole logging plan is readable at a glance.
Interval is the storage dial. One tag at 0 on a chatty analogue can outweigh fifty tags at 5. Start at 1–5 seconds for process values and only go lower where you genuinely need the resolution.
Watch the storage
The Storage panel at the top of the area refreshes every few seconds and answers "is this sustainable?" directly: Database size, Total samples, Variables tracked, and the Oldest / Newest sample timestamps. If the oldest sample is much younger than your retention setting, the cleanup pass is doing its job — or the project has not been running that long.
A row whose variable no longer exists on any datasource is flagged red and stops being logged. Re-point or remove it.
Put a trend on a page
Add a Trend Chart widget (catalog) and set:
- Variables — one row per line on the chart, added with + Add and set from the row's own dropdown, which lists exactly the variables you added in the Historian area — a tag that is not logged has nothing to draw. The
⌃/⌄buttons move a line up or down, and Line colors follows that order. (A Live buffer chart picks from the whole variable tree instead, through the usual✎binding picker — it reads values off the connection and needs no history at all.) - Default time range — the window the chart opens on, from 1 min to 30 days.
- Refresh interval (s) — how often it re-queries.
10by default;0freezes it on the first query, which suits a report screen. - Show zoom buttons — adds the range controls so the operator can widen or narrow the window themselves.
- Line colors — comma-separated colours matched to the variable list in order (
#2563eb, #dc2626). Leave it empty to use the theme's series colours.
Long windows are downsampled before they reach the browser — a 30-day query returns a few hundred points, not a million — so the widget stays responsive at any range.
Read the history from outside
The same store is queryable over REST, which is the route for a report generator or an MES:
GET /api/historian/query?variables=LinePLC:Motor1/Speed&start=-8h&end=now&maxPoints=500
start and end take an ISO-8601 timestamp, a relative offset (-30m, -2h, -7d), or now. The response is one series per variable, each a list of { t, v } points.