Diagnostics & troubleshooting
When a value doesn't arrive, a widget doesn't render, or a save doesn't stick, NEXT HMI already knows why — this chapter is a map of where it says so. Two panels do most of the work: the editor's Admin area for what the project is doing right now, and the manager's Settings page for what the installation is doing.
The Admin area (per project)
Pick Admin in the editor's left rail. Three live sections, refreshed while you watch.
Fast Subscriptions
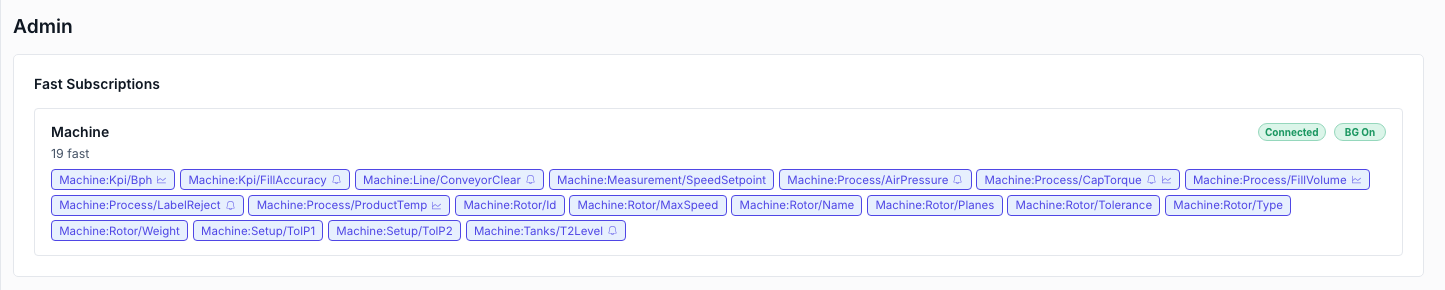
One card per OPC-UA datasource, each showing Connected / Disconnected, whether background polling is on, and every tag currently on the fast subscription — the ones refreshed first. Icons mark why a path is there: a bell for an alarm trigger, a chart for a historized variable; anything else is on the list because a visible widget binds it.
This is the panel that answers "why is my tag not updating?" — if the path is not listed, nothing is subscribed to it, and the answer is upstream (nothing binds it, its variable is disabled on the datasource, or the datasource is down).
Custom Widgets
Every widget found in the project's custom-widgets/ folder, with its build Status (OK / failed / unknown), whether it has CSS, and when it was compiled. Recompile one, or Recompile all — the route out of a stale build after editing files on disk. A failed build shows the compiler's own error message. See Building your own widgets.
A third state sits between the two: No schema. The widget compiled and renders fine, but its schema / exportedProperties exports could not be read, so the editor offers no property fields and no exported properties for it. The message underneath says why. Other widgets are unaffected — an unreadable widget costs only its own schema.
Connected Runtimes
Every open operator screen against this project: its scope, the user signed in there, that user's groups, and when it connected. Use it to confirm that the panel by the line really is signed in as operator and not still sitting on guest.
The manager's Settings page (per installation)
Sign in to the manager dashboard and open Settings — this is installation-wide, not per project.
| Section | Gives you |
|---|---|
| System Information | Backend uptime, Python version, process id. First stop after "did it restart?" |
| Runtime home | Where per-installation state lives — the manifest, logs, the widget-build cache, TLS material. See Installing and running. |
| Logs | Opens the Application logs viewer: the last 500 lines with the log file's path, a Refresh, and Download full log for the whole file. |
| Security | Change the device-admin password that gates the dashboard itself. |
| HTTPS | Certificate status, regenerate or upload your own, and restart into TLS. Full walkthrough in HTTPS. |
The warnings pill
The editor header runs a project-wide validation pass and shows a pill with the findings. Click it for the list; click a finding to jump straight to the widget, page, component, translation or custom widget it belongs to.
It reports things that are wrong but not fatal — a $var binding that names a variable no datasource offers, a variable or source whose type doesn't fit the field, a write aimed at a variable that isn't writable, an alarm with no source value, a recipe parameter that is unbound, a user in a group that no longer exists, a historian setting out of range, a custom widget that failed to compile. Saving is never blocked: a half-built screen is a normal state mid-edit.
Two findings are specific to reusable components:
- "component has no slot 'x'" — the widget names a slot the component no longer declares, so it renders in the component's first slot instead. Drag it into the group you meant, or put the slot back. A widget placed on a component that declares no slots renders nowhere and is flagged the same way.
- "
$componentPropis only substituted as a property's whole value" — inside the component, a$componentPropis nested in another source or sits on a Layout field. It fills in once and then stops updating. See Passing values into components.
While you have unsaved edits, the pill can only re-check the artifact you have open. Save to get the whole project re-validated.
Common symptoms
A bound field is blank or dimmed. The runtime distinguishes three failure states, and they mean different things — absent (the source can't produce a value yet), bad quality (connected but the tag reports bad/uncertain/stale), and disconnected (the whole datasource is down, which degrades every tag it owns). The table in Binding & subscribing says which is which.
A widget carries a coloured mark. Read the colour before you read the binding: red is a binding that doesn't resolve — a configuration error on the page — while amber is a sound binding that no value reached, which points at the datasource instead. The marks on a widget has the full set.
Opening a project URL says the project is unavailable. The URL you typed stays put and the overlay names the cause: it is not running (start it from the projects page), the instance crashed (start it again to see the failure), its folder is missing (use Locate…), or no project with that id is registered on this device. The way back to the projects page is on the overlay.
A value never updates, and never goes bad either. Check Fast Subscriptions: a tag that appears nowhere is not subscribed. Common causes: the variable is not enabled in the datasource's variable table, the binding points at a path that was renamed on the PLC (the browse-diff banner in the Datasources area flags this), or the widget binding it is not on a visible page.
A write is rejected. The reason code tells you which layer refused: read_only (the variable is not marked writable in the datasource — the server sends nothing to the machine), permission_denied (the signed-in user's groups are outside the variable's allowed set — see Users), opcua_unreachable, write_failed, invalid_value, bad_path. Attach an onFailed handler with a Show Toast of { $result: "reason" } and the panel tells the operator directly — see Actions.
Copy and paste in the editor say the clipboard needs HTTPS. navigator.clipboard is one of the browser APIs that exist only in a secure context — HTTPS, or localhost. Reaching the installation at a plain-HTTP LAN address (http://192.168.1.10:8000) removes it outright, so no permission prompt can restore it; serve the installation over HTTPS instead, or open it on the host at localhost. The full rule and what else it touches is in What plain HTTP costs the browser.
A custom widget doesn't appear, or renders the old version. Check its status in Custom Widgets and hit Recompile. A widget whose source imports React or an app helper will not build — the SDK globals are the only allowed route.
Nothing on the page reacts after editing files on disk. The editor and runtime react to saves made through the app. If you edited a page, component or datasource file directly on disk, restart the backend so it re-reads them.
The editor won't open. Editor access is not a group test, and no account in Users grants or withholds it. The editor sits behind the installation's device-admin password — the same one that unlocks the Manager dashboard — so whoever needs the editor needs that password. See Users.
A save reports a failure. Saves are per-area, and a failure names the area that refused rather than silently dropping the whole batch. Translations in particular refuse a save that would overwrite someone else's newer edit; reload and re-apply.
Log files
Application logs live under the runtime home in .logs/. Read the tail in the viewer, or Download full log and grep it. When reporting a problem, that file plus the backend uptime and version from System Information is what makes a report actionable.