
Everything it does, on one page.
Every shot below is the software itself — the editor, the pickers, the alarm and historian views — working on one project: a bottling line called Aquavane, against a live OPC-UA server. Clean interface, and realtime data while you configure.
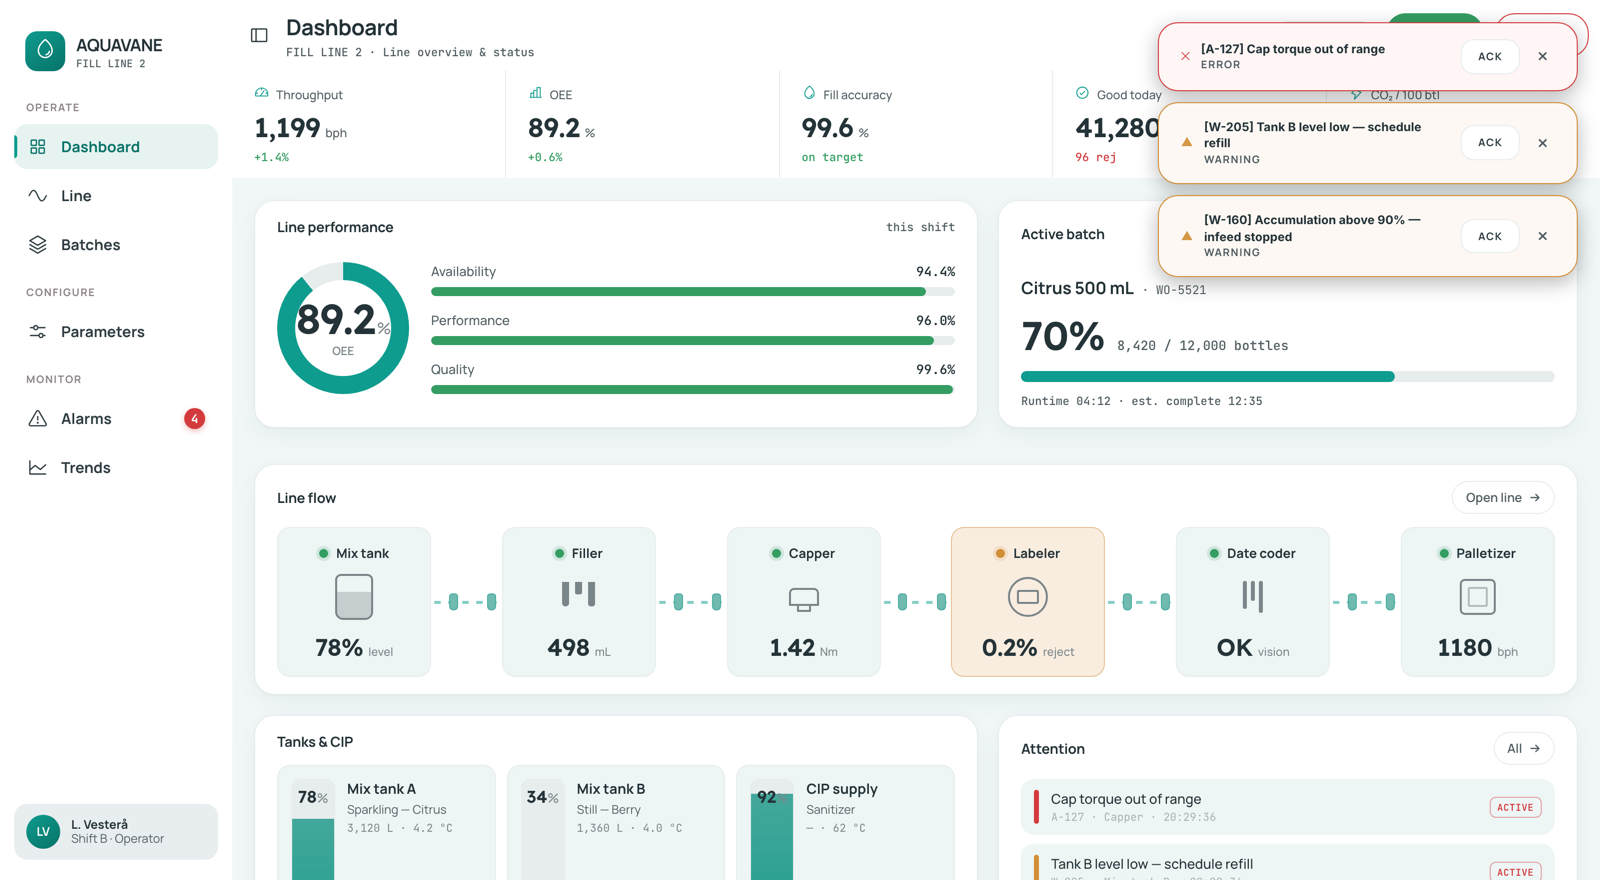
What you drag is already reading the machine.
Many HMI tools show you placeholders until you compile, deploy or start a simulation. In NEXT HMI the editor canvas is the runtime: bind a property to a tag and the live value is on the widget before you have closed the picker. A threshold, a colour rule or a unit conversion is checked against the real process while you write it, not after the next download to the panel.
Machine:Process/ProductTemp, picked through the Machine datasource; the canvas shows the product temperature straight away, with the rest of the header still updating around it.A project is a folder of plain files.
Pages, alarms, recipes, datasources and themes are JSON; translations are CSV. No binary project file that only one version of one tool can open — so the change control your team already runs on its code works on the HMI too.
- Review before it reaches the line — a changed alarm limit is a one-line diff in a pull request, not a note in a commissioning log.
- Roll back to last week's screens with the same command as anything else in the repository.
- Template and copy — a new line starts as a copy of the last one, and moves as a folder or a zip.
Any property. Any source. No scripting.
Every property has a type and a source. Leave the source as a literal and you have typed a number in a box; swap it and the same property now reads a tag, branches on a comparison, resolves through a dictionary, or answers differently on a phone than on a panel PC.
The sources nest, so a colour can switch on a live tag, inside a label that resolves through a translation, inside a layout that branches by viewport. One idea, learned once, and it covers every property on every widget — including the ones on the custom widgets you write yourself. Nothing for your integrators to script, review or debug at 2 a.m.


One project. Panel PC, tablet, phone.
Not three projects kept in step, and not a desktop layout squeezed onto a handset. Every layout property — direction, size, spacing, whether a widget is on the screen at all — takes the same $viewport source as any other property, so one page file serves the panel at the machine, the tablet in the QA office and the phone in the maintenance engineer's pocket.

An alarm that tells you what to do about it.
Every alarm carries a code, a severity, a plain-language explanation and a list of resolutions — authored once, shown wherever that alarm surfaces. The night-shift operator gets the same three steps the process engineer would have given them.
- One definition, three views — toast, list and dialog read the same alarm; change the text once.
- Acknowledge per alarm, with an acknowledge all for the shift handover.
- An event log that keeps the pairs — raised at, cleared at, and whether anyone ever acked it.
- Who may acknowledge is set per alarm by user group — the same groups that decide which widgets an operator can see or press.

Keep the history as long as you need it.
Pick the tags worth keeping and give each one its own sample interval and retention: a week of a noisy analogue at one second, years of a shift counter. History is stored on the server itself, per project — no historian add-on, no separate time-series database to stand up and back up. A tag you log is recorded whether or not a screen shows it, and old samples are pruned by the retention you set, not by a licence tier.

Recipes and language are editors, not exports.
Two things every plant asks for late in the project, and both are first-class here — stored as JSON and CSV beside the pages, so they diff, review and travel with the rest of it. Theming works the same way; see Extend for the full picture, since that one belongs to the programmer doing the white-labelling as much as to the engineer running the plant.


$loc is here, searchable, with a column you add rather than a project you clone. The runtime switches language without a reload.Want the hard numbers instead — every widget, every source, system requirements, protocols and limits? That is Specs. Want your own widgets, components, connectors or house style? That is Extend.
Who did what to the machine, on record.
For plants that answer to a regulator. The audit trail records who acknowledged which alarm, who wrote a value to the machine, and who signed in or out, with the time against each. Configuration work is left out on purpose: this is a record of what operators did to live equipment.
It is the one part of NEXT HMI that is not open source and comes with the enterprise build. What it records is in the docs; what it costs is on Pricing.